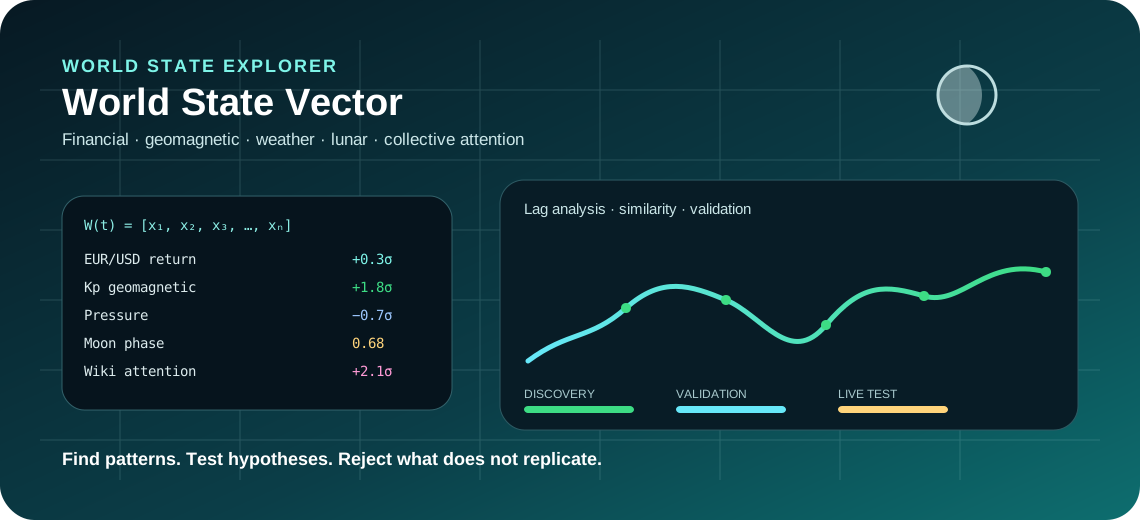
The world appears extraordinarily complex. Financial markets, weather, the Sun, the geomagnetic field, earthquakes, human behaviour, collective attention and numerous natural cycles all change according to their own rhythms. At first glance they look like separate systems.
But complexity does not mean that no structure exists between them.
Mathematics and physics often show that very complicated behaviour can emerge from relatively simple rules. A simple differential equation can generate chaotic motion. A small set of connected feedback loops can produce surprising system-level behaviour. A small change in one input variable, at the right moment, can sometimes produce a large response.
World State Explorer is a research project designed to search for such relationships in real-world data.
It does not begin with the assumption that a relationship must exist. Quite the opposite: the system should first collect the data, and then mathematics should show which relationships are interesting, which repeat and which disappear when they are tested on new data.
The central idea is simple:
If we can describe enough different parts of the world in the same time framework, we can begin to study how the state of the world changes and whether particular combinations of present-day data contain information about future states.
What is a World State Vector?
Imagine taking a mathematical “snapshot of the world” every hour or every day.
That snapshot could contain, for example:
- the EUR/USD exchange rate,
- the daily EUR/USD return,
- the Kp geomagnetic index,
- Hp30 or Hp60,
- the F10.7 solar radio flux,
- solar-wind speed,
- temperature,
- atmospheric pressure,
- humidity,
- precipitation,
- earthquake activity,
- lunar phase,
- lunar illumination,
- interest in selected Wikipedia topics,
- other financial, natural or social indicators.
Mathematically, such a state can be written as a vector:
W(t)=[x_1(t),x_2(t),x_3(t),...,x_n(t)]where W(t) is the state of the world at time t, and each x represents a selected measurable variable.
A simplified example:
Date                   2026-09-01
EUR/USD                1.16
EUR/USD daily return  -0.42 %
Kp                     3.0
F10.7                  148
Air pressure           1007 hPa
Temperature            21.2 °C
Moon illumination      68 %
Wikipedia: Recession   0.74
Wikipedia: Anxiety     0.61
A single vector is not especially interesting. Its history is:
W(t_1),W(t_2),W(t_3),...,W(t_N)After several years, we may have thousands or millions of time-aligned observations. That is when much more interesting questions become possible.
What are we trying to discover?
World State Explorer is not intended merely to display charts. Its main purpose is to search for structure and repeatable patterns in multidimensional time series.
1. Do two variables move together?
The simplest question is:
Do X and Y change in a similar way over time?
Pearson or Spearman correlation can be used as an initial tool.
corr(Kp,\ EURUSD\_return)But correlation is only a first filter. A strong correlation does not mean that Kp affects EUR/USD. Both variables could be connected to a third factor, or the relationship could simply be random.
2. Does the relationship appear with a delay?
In complex systems, an effect is often not immediate. It can therefore be more interesting to study:
X(t)\rightarrow Y(t+\tau)where τ is a time lag.
For example: does a change in geomagnetic activity today coincide with a change in another variable 6 hours, 24 hours, 3 days or 7 days later?
The program can automatically examine many different lags and identify the interval where the statistical relationship is strongest.
Kp → EUR/USD return

0 days      r = 0.03
+1 day      r = 0.08
+2 days     r = 0.16
+3 days     r = 0.05
Even such a result is not evidence of causation. It can, however, become an interesting research hypothesis.
EUR/USD as a practical example
Financial markets are particularly useful for this type of research because long historical series are available, observations are precisely time-stamped and outcomes are objectively measurable.
World State Explorer can obtain a multi-year history of the official EUR/USD reference rate from European Central Bank data.
But looking only at EURUSD(t) is not enough. The exchange rate itself is a trending time series. Comparing two trending time series can create a high but meaningless correlation.
Transformed signals are therefore also important, such as the daily logarithmic return:
r_t=\ln\left(\frac{P_t}{P_{t-1}}\right)and the absolute change:
|r_t|The first describes direction; the second is a rough measure of movement intensity.
This makes it possible to ask more meaningful questions:
Does a particular combination of global variables increase the historical probability of a larger EUR/USD move on the following day?
or:
Have certain world states historically been followed more often by rising or falling EUR/USD values?
That is much more useful than asking only: “Is the Moon connected with EUR/USD?”
Why include lunar cycles?
Lunar cycles are included because they are precisely defined periodic variables, not because World State Explorer assumes in advance that they affect financial markets or human behaviour.
NASA notes that the lunar phase cycle repeats roughly every 29.5 days. The mean synodic month is approximately 29.53059 days.
For mathematical analysis, continuous variables are more useful than only labels such as new Moon, first quarter, full Moon and last quarter.
For example:
phase\in[0,1)sin(2\pi\cdot phase)cos(2\pi\cdot phase)Why use two variables? Because lunar phase is circular. A phase of 0.99 is mathematically very close to 0.01, even though they would appear almost maximally far apart on an ordinary linear scale. Sine and cosine components preserve the circular geometry of the cycle.
Importantly, World State Explorer does not claim that lunar phase affects EUR/USD. It treats this as a testable hypothesis. If no stable effect survives multi-year data and later validation, the hypothesis should be rejected.
A negative result is still a result.
The Sun and the geomagnetic environment
Another interesting group of data comes from space weather.
GFZ Helmholtz Centre for Geosciences publishes long histories of geomagnetic indices such as Kp and ap, together with solar indices including SN and F10.7. Kp data extend back to 1932. Newer Hp30 and Hp60 indices provide higher temporal resolution.
A World State Vector can therefore include:
Kp
Hp30
Hp60
F10.7
Sunspot number
and additional space-weather variables later.
This makes it possible to ask whether particular geomagnetic states statistically co-occur with other signals, whether characteristic time lags exist, whether relationships appear only during certain periods, and whether similar geomagnetic states have historically been followed by similar patterns.
Again, association does not automatically imply causation.
Weather as part of the global context
Open-Meteo provides access to historical reanalysis data such as ERA5. ERA5 contains global hourly data extending back to 1940.
Useful signals include temperature, relative humidity, pressure, wind, precipitation and solar radiation.
Weather is especially interesting because it can act as a hidden common variable. Suppose we find a correlation between signal X and behaviour Y. If both are actually strongly driven by temperature or seasonality, the original relationship may be misleading.
More variables therefore do not simply mean more data. They also give us a better chance to rule out alternative explanations.
Wikipedia as a sensor of collective attention
The Wikimedia Pageviews API is another unusual but useful source.
It does not measure emotion directly. It measures something objective: how many times users viewed a particular article in a given period.
By combining several topics, we can create rough indicators of collective attention around themes such as Anxiety, War, Recession, Earthquake, Insomnia, Meditation, Happiness, Gold, Euro or United States dollar.
Possible research signals include:
WIKI_ANXIETY
WIKI_RECESSION
WIKI_WAR
WIKI_GOLD
Such a signal does not mean: “The world is 73% afraid today.” It means only that interest in a selected topic is unusually high or low compared with its own historical pattern.
That distinction is fundamental.
Wikimedia also introduced stricter limits for automated API access in 2026, so a responsible client must respect rate limits and HTTP Retry-After responses.
Normalization: how do we compare incompatible units?
The problem with a World State Vector is obvious. EUR/USD might be 1.16, air pressure 1014, Kp 3 and temperature 21. These values cannot be compared directly.
We therefore standardize them. One simple method is the z-score:
z=\frac{x-\mu}{\sigma}where x is the current value, μ the historical mean and σ the standard deviation.
EUR/USD return      +0.3 σ
Kp                  +1.8 σ
Pressure            -0.7 σ
Wikipedia Anxiety   +2.1 σ
This makes it easier to see which signals are unusual relative to their own history.
For serious time-series validation, the mean and standard deviation must be calculated using only data that would have been available at that moment. Future information must not be used to normalize the past.
What does a “similar historical world state” mean?
One of the more interesting functions is the search for historical vectors most similar to the present state.
Let the current state be:
W_{today}We then search history for:
W(t_i)\approx W_{today}A result might look like this:
Most similar historical states:
17 Sep 2019   similarity 94 %
4 May 2021    similarity 92 %
11 Aug 2017   similarity 90 %
The next question is: what happened after those similar states?
After 24 hours:
EUR/USD higher       6 of 10 cases
EUR/USD lower        4 of 10 cases

After 7 days:
average return       +0.31 %
This is not fortune-telling. It is conditional historical probability analysis.
P(Y_{future}|W_{today})That is very different from saying something must happen tomorrow because it happened ten times in the past.
Mutual Information: when correlation misses the relationship
Pearson correlation is good at detecting approximately linear relationships. Complex systems are often nonlinear.
A relationship can exist where:
corr(X,Y)\approx0although Y still contains information about X.
This is where Mutual Information can be useful:
I(X;Y)The idea is simple: how much uncertainty about Y is reduced when X is known?
If I(X;Y)=0, the variables share no information in the ideal statistical sense. If I(X;Y)>0, some statistical dependence exists, potentially nonlinear.
Mutual Information still does not prove causation. It is simply an additional tool for discovering relationships that ordinary correlation can miss.
The greatest danger: millions of random “discoveries”
This is probably the most important part of the entire project.
Imagine 100 signals. The number of unique pairs is already:
\frac{100\cdot99}{2}=4950If we test another 100 time lags for every pair, we reach:
495,000statistical comparisons.
With that many tests we will almost certainly find something that looks remarkable even when no real relationship exists.
A small p value is therefore not enough. World State Explorer uses the concept of the False Discovery Rate (FDR). The classic Benjamini-Hochberg procedure was created precisely to control the expected proportion of false discoveries in multiple testing.
Without such protection, the program could quickly become a machine for manufacturing apparent miracles.
Discovery and Validation must remain separate
The strongest protection against self-deception is simple: split the data.
2017–2024    DISCOVERY
2025         VALIDATION
2026         LIVE VALIDATION
The older period is used to search for interesting relationships. Suppose the system finds:
X(t) → Y(t+2 days)
Once the hypothesis is created, the formula should be frozen. It must not be changed merely to fit the validation period better.
It is then tested on a period that was not used during discovery.
Discovery       PASS
Validation      FAIL
Status:         REJECTED
That is not a failure of the system. It means the system correctly removed an apparent relationship.
A much more interesting result is:
Discovery       PASS
Validation 1    PASS
Validation 2    PASS
Live 2026       PASS
Status:         REPLICATED
Only then does the hypothesis become genuinely interesting for further investigation.
Correlation is not causation
If the program finds:
X(t)\leftrightarrow Y(t+1)that does not mean:
X\rightarrow YPossible explanations include at least the following: X affects Y; Y indirectly affects X; a third variable Z affects both; the relationship is caused by seasonality; data or timing bias is present; the result is random; or both variables are part of a larger common dynamical system.
Causal inference from time series is an active scientific field. Jakob Runge and colleagues, for example, have examined both the possibilities and the limitations of causal inference in complex Earth-system time series.
World State Explorer therefore treats detected relationships as candidates for further testing, not as automatically proven causes.
What might we actually find?
The project is interesting precisely because the outcome is not predetermined.
1. No stable relationship
Moon phase → EUR/USD
Discovery: interesting
Validation: no effect
Conclusion: the analysed data do not support a stable predictive relationship. That is a useful result.
2. A relationship exists but is trivial
An algorithm may discover temperature ↔ month of year. The relationship is real but not surprising. Such results are still useful for checking whether the analytical pipeline works correctly.
3. A hidden common variable is found
X and Y appear related at first. After adding Z, the relationship disappears. This suggests that the original relationship may have been explained by a third variable.
4. A stable lag is found
If a relationship between X today and Y 18 hours later survives several independent validations, it becomes much more interesting for further analysis.
5. Repeating “world regimes” are identified
With enough data, clustering and related methods can search for recurring states such as:
REGIME A  calm financial and geomagnetic environment
REGIME B  elevated geomagnetic activity
REGIME C  high financial volatility
REGIME D  high collective attention
REGIME E  rare or anomalous state
Transitions such as R_A → R_C or R_D → R_B can then be studied. This can be thought of as a kind of mathematical weather for a complex system.
Searching for equations rather than only correlations
A longer-term direction is to ask something more ambitious than “which variable is connected to which?” We can ask whether a relatively simple equation describes part of the dynamics.
SINDy — Sparse Identification of Nonlinear Dynamics — was developed to discover parsimonious dynamical equations from data.
\dot{x}=f(x)The algorithm receives measured data and a large library of possible mathematical terms, then attempts to select a small subset that best explains the observed dynamics.
This is attractive because the result need not be only a black-box neural network. It can be an interpretable equation. A similar approach may eventually be applied to the World State Vector.
What World State Explorer must not become
The project needs methodological discipline.
We do not want software that reacts to every random result by writing statements such as “the Moon affects the euro” or “the geomagnetic field predicts the market.” Without appropriate evidence, such claims would be misleading.
A scientifically responsible statement is closer to:
During the discovery period, a statistical relationship was detected between two variables at a specific time lag. The relationship did or did not survive independent validation.
That sounds less spectacular. It is also far more valuable scientifically.
How to use World State Explorer
1. Import historical data
Start by importing a multi-year history. For initial research, several years are useful. For EUR/USD, for example, the period from 2018 to the present already contains several different market regimes.
Because public APIs impose limits, data are imported in smaller batches through a queue. This also makes the system practical on ordinary PHP hosting.
2. Inspect signals
In Signals, check whether a signal is registered, how many measurements it contains, the earliest date available and when the latest observation was received.
If a source shows 10 signals / 0 measurements, the signals are configured but the import has not yet succeeded.
3. Use the main chart
The main page allows a primary and comparison signal to be selected, for example EUR/USD return against Moon illumination or EUR/USD absolute return against Kp.
Zooming and panning make it possible to move from a multi-year overview to an individual period of interest.
4. Explore time lags
Select X, Y and a lag range, for example X = Kp, Y = EUR/USD daily return, lag -30 ... +30 days.
The program searches for the lag where statistical association is strongest. The result should still be treated as a hypothesis.
5. Search for similar historical states
Select the present or any historical World State Vector. The program searches for the most similar previous states and then examines what typically happened afterwards.
This is especially interesting for financial and other dynamic signals.
6. Save hypotheses and validate them
Promising relationships can be saved as research hypotheses. A hypothesis should contain at least signal X, signal Y, time lag, method, discovery period, formula or parameters, and creation date.
From that point on, it should not be adjusted in response to validation results.
Why SQLite?
The first version of World State Explorer uses SQLite.
That choice is practical because it does not require a separate database server, the entire database can be stored in a single file, backup is straightforward, it is well suited to analytical workloads of this scale and PHP supports it directly.
The official SQLite documentation explicitly lists small-to-medium websites and data analysis among appropriate uses.
The architecture can later move to MySQL or PostgreSQL if scale or deployment requirements make that preferable.
Where can the project go next?
Fourier analysis
Fourier methods can search for periodic components:
X(t)=\sum_k A_k\sin(2\pi f_k t+\phi_k)This can reveal cycles that are not obvious in a chart.
Wavelet analysis
A Fourier transform tells us which frequencies exist in the signal overall. Wavelet analysis can also help answer when a cycle appeared and when it disappeared.
That is often more useful in non-stationary systems.
Causal discovery
Methods such as the PCMCI family were designed to search for candidate causal relationships in multidimensional time series. This is a natural later step once the underlying data collection is sufficiently large and reliable.
Symbolic regression and SINDy
Rather than only searching for statistical dependence, the system could search for interpretable equations such as:
Y(t+1)=aX_1(t)+bX_2(t-\tau)+cX_1(t)X_3(t)If a simple equation successfully predicted unseen data over several years, that would be a genuinely interesting result.
Personal measurements
A future World State Vector might also include local or individual measurements such as HRV, EEG, EDA, sleep quality, physical activity, subjective wellbeing and other sensors.
We could then investigate:
HumanState(t)\leftrightarrow WorldState(t)The same rule would still apply: data first, then hypothesis, then independent validation.
Investigating unusual hypotheses as well
World State Explorer can remain open to less conventional hypotheses. That is not a problem in itself.
The scientific method does not require us to investigate only conventional ideas. It does require that a hypothesis be clearly defined, measured objectively, tested statistically, corrected for multiple testing, checked on new data, compared with alternative explanations and rejected if it fails.
It is therefore legitimate to test whether lunar phase is associated with a time series. It is not legitimate to take a short period or a single correlation and conclude that the Moon causes the effect.
The same principle applies to geomagnetism, financial markets, collective behaviour and every other candidate relationship.
The most important idea of the project
The goal of World State Explorer is not to produce a single “formula of the world.”
A more realistic goal is to discover local regularities, repeating regimes, characteristic time lags, hidden nonlinear relationships, unusual anomalies and combinations of variables that carry predictive information.
The world may be too complex for one equation. That does not mean it contains no simple structures.
A better abstraction might be:
W(t+\Delta t)=F(W(t),E(t))where W(t) is the currently measurable state, E(t) represents external or unmeasured influences and F describes the system dynamics.
World State Explorer attempts to learn at least part of F from data.
Conclusion
We have access to more public data than at any previous point in history. The ECB publishes long financial time series. GFZ measures the geomagnetic environment. Meteorological reanalyses provide decades of historical weather. Wikimedia can act as a rough sensor of collective attention. Astronomical cycles can be calculated precisely.
Individually, they are just data.
When aligned in time inside a common World State Vector, they become something different: a mathematical description of part of the world at a particular moment.
We can then ask which states repeat, what tends to happen after similar states, which signals contain information about future signals, which relationships disappear under independent validation and whether simple regularities exist that are not visible when charts are examined separately.
The most important principle is that the system should not be told what it must find.
Let the data show whether the relationship is real.
And if an interesting relationship does not survive testing, reject it.
That combination of openness to unusual ideas and rigorous verification is the central purpose of World State Explorer.
Important note
World State Explorer is a research and experimental tool. Statistical relationships, historical similarities and models do not guarantee future events.
Financial analyses, including EUR/USD analysis, are not investment recommendations. The European Central Bank publishes its reference exchange rates for information purposes and advises against using them for transaction purposes.
Sources and further reading
- European Central Bank – ECB Data Portal, API documentation. Programmatic access to official ECB statistical time series, including exchange rates. https://data.ecb.europa.eu/help/api/overview
- European Central Bank – Euro foreign exchange reference rates. Official methodology and reference exchange rates against the euro. https://www.ecb.europa.eu/stats/policy_and_exchange_rates/euro_reference_exchange_rates/
- GFZ Helmholtz Centre for Geosciences – Kp Index Data. Kp, ap, Ap, SN, F10.7 and API access; Kp data extend back to 1932. https://kp.gfz.de/en/data
- GFZ – Hp30 and Hp60 indices. Geomagnetic indices with 30- and 60-minute temporal resolution. https://kp.gfz.de/en/hp30-hp60/data
- Open-Meteo – Historical Weather API. Access to ERA5 and other historical meteorological datasets. https://open-meteo.com/en/docs/historical-weather-api
- NASA Science – Moon Phases. Explanation of lunar phases and the approximately 29.5-day lunation cycle. https://science.nasa.gov/moon/moon-phases/
- Wikimedia Analytics – Pageviews API. Time series of article views across Wikipedia and related projects. https://doc.wikimedia.org/generated-data-platform/aqs/analytics-api/
- Wikimedia APIs – Rate limits. Current rules for automated access and rate limiting. https://www.mediawiki.org/wiki/Wikimedia_APIs/Rate_limits
- Runge, J. et al. (2019). Inferring causation from time series in Earth system sciences. Nature Communications 10, 2553. DOI: 10.1038/s41467-019-10105-3
- Brunton, S. L., Proctor, J. L., Kutz, J. N. (2016). Discovering governing equations from data by sparse identification of nonlinear dynamical systems. PNAS 113(15), 3932–3937. DOI: 10.1073/pnas.1517384113
- Benjamini, Y., Hochberg, Y. (1995). Controlling the False Discovery Rate: A Practical and Powerful Approach to Multiple Testing. Journal of the Royal Statistical Society, Series B 57(1), 289–300. DOI: 10.1111/j.2517-6161.1995.tb02031.x
- SQLite – Appropriate Uses for SQLite. Official guidance on SQLite for web applications, local storage and data analysis. https://www.sqlite.org/whentouse.html
Short definition
World State Explorer is a research system for collecting, time-aligning and mathematically analysing diverse public time series. Using the World State Vector concept, it searches for correlations, time lags, nonlinear dependencies, anomalies, similar historical states and candidate predictive relationships. Every interesting relationship should then be tested on data that were not used to discover it.