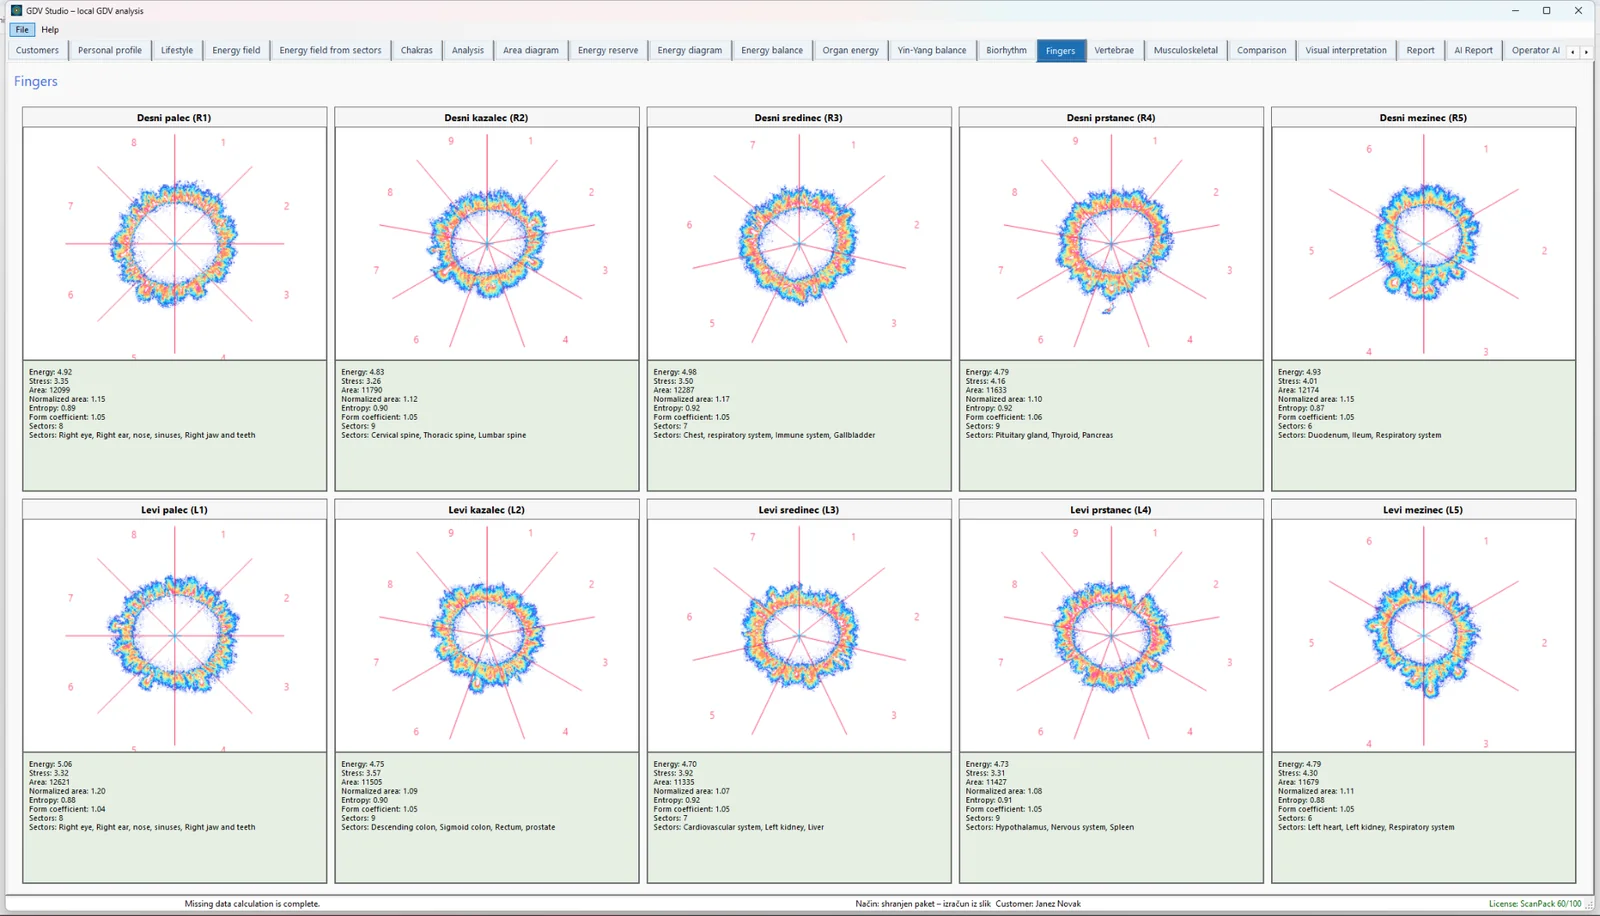
Why one GDV scan is not enough
With any image-based measurement there is a risk of treating an unusual picture as a biologically meaningful signal too quickly. Finger placement, pressure, skin moisture, electrode contact, electrical conditions, time of measurement, environment and image processing can all influence a capture. A stronger research sequence is therefore: capture quality → repeatability → image description → reference comparison → time dynamics → interpretation.
This is also the direction we want GDV Studio to support. The software should not only ask “what is today’s value?” but also “is the measurement technically stable?”, “does the pattern repeat?”, “how far is it from this person’s usual state?” and “does it return toward baseline after a load or intervention?”.
1. Measurement Stability: does the measurement repeat?
Elena Yanovskaja’s presentation Bio-Well Analysis Details explicitly discusses repeatability. For the neurodynamic view shown in the presentation, she states that at least three measurements in Full Scan mode should be added. That is not evidence that three scans are universally sufficient for every application, but it is a useful methodological principle: repeated captures allow us to estimate how much of the result is stable and how much may be transient measurement variability.
In GDV Studio this could become a quantitative Measurement Stability module. Instead of only looking at three images, the software could calculate dispersion across repeats for each finger and each morphology feature: mean, standard deviation, coefficient of variation, robust median and range.
| Question | Possible metric | Why it matters |
|---|---|---|
| Does total area repeat? | CV, SD, range | Separates stable signal from variable capture. |
| Does a gap occur in the same place? | spatial overlap / Jaccard | Tests whether a local structure is reproducible. |
| Is contour complexity similar? | fractal measure, roughness, entropy | Compares shape rather than only size. |
| Is one scan an obvious outlier? | robust outlier score | Flags a technically questionable capture. |
Such a result would not be a health score. It would describe measurement stability under the stated acquisition conditions.
2. Personal Baseline: the individual as their own reference
One of the most useful concepts in the IUMAB Proceedings is Christophe André’s longitudinal approach. His baseline is not a Bio-Well norm and not a population average. It is a personal reference period built from sufficiently comparable measurements of the same person before an event or disruption.
This is particularly useful in research on workload, recovery or long-term change. If a participant collects a series of measurements during an ordinary period, we obtain an individual distribution. A later value can then be expressed as a standardized deviation from that person’s own reference.
Z = (x − μbaseline) / σbaselineThe result expresses how many baseline standard deviations today’s value is from the person’s reference distribution. It does not explain why the change occurred.
André also uses RMS-Z as a global distance and N2/N3 as counts of variables beyond |Z| > 2 or |Z| > 3. The attraction is that the analysis can show both which feature changed and how far the overall configuration moved from personal baseline.
For GDV Studio this could turn longitudinal analysis into more than a raw-value chart. A researcher could define a reference period and then inspect the largest deviations, global RMS-Z distance and the breadth of out-of-range features.
3. Morphology: from total area to corona structure
Konstantin Korotkov’s Bio-Well 2026 presentation lists research parameters including normalized area, inner noise, isoline radius and length, area, isoline fractality, isoline entropy and form coefficient. That is relevant to GDV Studio because it reinforces the idea that the geometry and complexity of the image can be investigated alongside aggregate “energy” values.
There is an important limitation: sharing a parameter name does not prove that two software packages use the same mathematical definition. Unless the exact Bio-Well algorithms are documented, GDV Studio should not claim that its “fractal” or “entropy” measure is numerically identical. The correct approach is to define, document and validate independent image metrics.
This is the core of morphology-oriented analysis: area, radial thickness, continuity, perimeter, contour complexity, local gaps, satellites, streamers, texture and intensity distribution. These features become much more meaningful when capture quality and repeatability are known.
4. Why multi-stage segmentation may improve morphology analysis
Weak peripheral structures can disappear when an image is reduced to a single binary threshold. A future morphology engine should therefore compare multiple segmentation strategies: global and local thresholds, grayscale gradients, top-hat filtering, morphology operations and multi-level intensity analysis.
The aim is not to create a more dramatic image. It is to preserve traceability. The original source image should remain unchanged, and every derived mask should be reproducible from known algorithm parameters. That allows us to test whether a new version truly improves weak-streamer detection rather than simply changing a threshold.
5. Trajectory: the path may matter more than one result
André’s move from an isolated label to a trajectory is methodologically valuable. Instead of asking “what does today’s scan mean?”, we ask “how did the measurement profile move away from personal baseline, and is it returning after a load?”.
For occupational-load research, a simple design could use pre-shift → post-shift → recovery. With reasonably standardized acquisition conditions, each morphology feature can be tracked for direction and magnitude of change. The design becomes stronger when GDV is accompanied by HRV, validated questionnaires and, where appropriate, an independent biomarker such as salivary cortisol.
This is more informative than a single universal “stress 72” score because it does not assume that one number has the same meaning for every person.
6. Pattern Atlas: relationships among features
The second part of André’s framework is an Atlas. The presentation describes a workflow using 36 variables, daily means, linear detrending, pairwise Pearson correlations, a strong-link threshold at |r| ≥ 0.50 and Louvain community detection.
This is interesting because it asks whether the relational structure among features changes over time. A similar experimental module in GDV Studio Research could explore relationships among morphology features across fingers, HRV variables or other independent measurements.
7. The most important upgrade: multimodal validation
A 2026 systematic review by Parshwal and Kaur included 20 empirical studies published from 2000 to 2025. The authors report interesting associations between stress and GDV-derived parameters but also highlight major limitations: heterogeneous study designs, different protocols, few high-quality controlled studies, limited transparency of proprietary algorithms and insufficient validation against established psychological and physiological measures.
The review specifically notes that standardized psychological measures and physiological biomarkers such as HRV or cortisol would strengthen convergent validity. This is central to the direction of GDV Studio Research: GDV should not validate itself. If we investigate workload or recovery, GDV features should be compared with measurements that are methodologically independent.
| Layer | Example | Research role |
|---|---|---|
| GDV/EPI | morphology, area, contour, texture | image signal under investigation |
| Autonomic system | HRV: RMSSD, SDNN, heart rate | independent physiological comparator |
| Psychological state | validated stress or burnout scale | standardized self-report measure |
| Biomarker | salivary cortisol | additional independent physiological layer |
| Context | sleep, shift, caffeine, activity | potential confounders and covariates |
8. What Beverly Rubik’s approach can teach us
Beverly Rubik’s presentation is useful mainly as an example of pre/post study organisation. It shows a large export space and then a smaller selected set of variables for statistical comparison. Importantly, one striking case slide explicitly warns that the Bio-Well changes shown cannot be interpreted as evidence of tumour regression.
That is a useful methodological model: we can describe a measurement and a change, while causal or clinical interpretation must remain separate until supported by independent evidence.
9. What this means for GDV Studio
These sources suggest a development path that does not copy proprietary Bio-Well interpretation algorithms. Instead, it builds a transparent research layer around the source image. GDV Studio already provides important foundations — local measurement handling, image review, morphology-oriented analysis, comparison and longitudinal views — while the items below represent a logical next research layer.
- Measurement Stability. Three or more repeats, automatic variability metrics and clear flags for unstable features.
- Personal Baseline. User-defined reference periods, Z-scores, RMS-Z and breadth of excursions.
- Morphology Engine. Documented independent definitions for area, contour, fractal complexity, entropy, gaps and texture.
- Algorithm Comparison. Side-by-side original BDF values, legacy calculations and new morphology outputs, preserving disagreement rather than hiding it.
- Adaptive Trajectory. Baseline → load → deviation → recovery.
- Experimental Pattern Atlas. Network analysis clearly labelled as statistical research, not anatomical interpretation.
- Multimodal Research. Time-aligned GDV with HRV/ECG, questionnaires, cortisol and measurement context.
10. What we should deliberately refuse to claim
Scientific credibility depends as much on what we do not claim as on what we build. A conference presentation is not enough to recreate a proprietary health index if its exact validated definition is unavailable. Nor can a statistical cluster of image features be used to diagnose disease in a specific organ.
GDV Studio should therefore keep three layers visibly separate: measured, calculated and interpreted.
Conclusion: from a striking image to a verifiable measurement process
The most useful lesson from these research directions is not another “magic” score. It is a move from the single scan toward a disciplined process: technically sound capture, repeatability, independently defined morphology, personal baseline, longitudinal trajectory and validation against external measures.
If specific morphology features prove reproducible and systematically co-vary with HRV, validated psychological scales or biomarkers in well-designed studies, that will be scientifically interesting. If they do not, the software should reveal that just as clearly. That is the direction of evidence-first GDV research software.
Sources and further reading
- IUMAB Proceedings 2026-01 — 11 presentations.
- Christophe André — Longitudinal Bio-Well Analysis — personal baseline, Z/RMS-Z, N2/N3, Trajectory and Atlas.
- Elena Yanovskaja — Bio-Well Analysis Details — repeatability and repeated Full Scan measurements.
- Konstantin Korotkov — Bio-Well 2026 — research image parameters.
- Beverly Rubik — Measuring Transformation with Bio-Well — pre/post research example.
- Parshwal & Kaur (2026) — systematic review of 20 empirical studies.
- GDV Studio and Bio-Well software and independent GDV analysis.