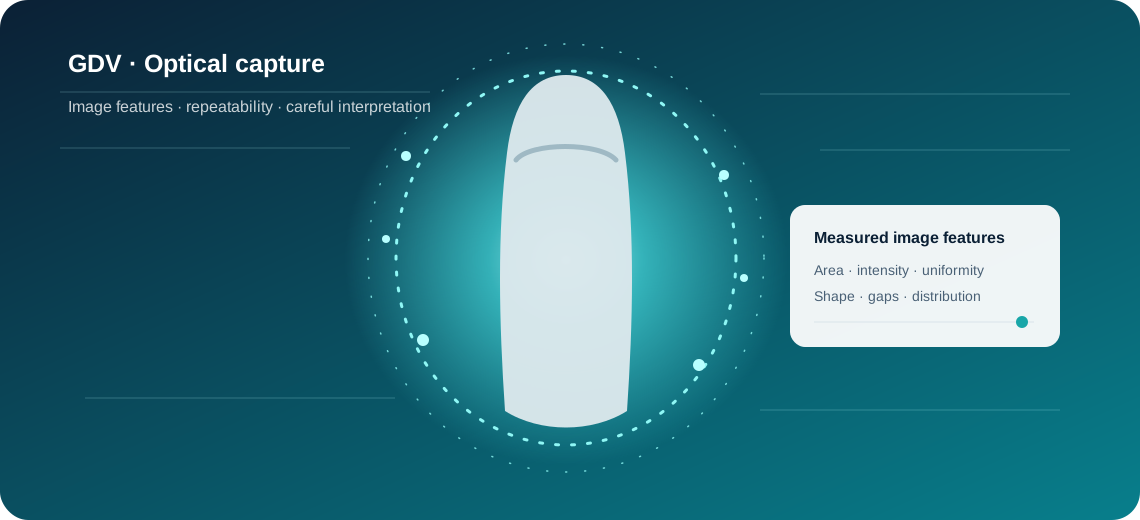
Gas Discharge Visualization (GDV), often also called Electro-Photonic Imaging (EPI), is a modern digital development of approaches that originated in Kirlian photography. During a measurement, the fingertip is exposed to a brief high-voltage electromagnetic field. A corona or gas discharge is generated in the surrounding gas, the luminous pattern is captured by a camera, and software then calculates different geometric and intensity-related parameters from the image.
At first glance the procedure is simple: a finger, an electrical pulse, a luminous ring and an image. In reality, however, the information content of the image is much richer. The corona contains measurable information about area, intensity, radial thickness, continuity, gaps, the outer boundary, local protrusions, texture, asymmetry and temporal stability. At the same time, the image is sensitive to skin moisture, contact with the glass surface, temperature, perspiration and other physical factors.
For exactly this reason, GDV has considerable research potential but also important limitations. If the technology is to be developed seriously, three things need to be kept clearly separate:
- what the device directly measures;
- which statistical associations have been observed in research;
- which interpretations arise from traditional or exploratory models, such as sector mappings to organs, meridians or chakras.
That distinction is fundamental to a credible future for GDV.
What does GDV actually measure?
The physical phenomenon of corona discharge itself is not controversial. A strong electric field ionizes gas near the surface of an object. This produces a luminous pattern that can be photographed and analyzed digitally.
A classic study by Pehek, Kyler and Faust, published in Science in 1976, showed that Kirlian corona images are strongly influenced by surface moisture, electrical conditions and discharge dynamics. The authors demonstrated that moisture can change corona density, streamer directions and other image features. This is a crucial point: a change in the corona image is not automatically evidence of a change in an “organ” or “energy center.” First and foremost, it is a change in a physical discharge pattern.
Modern Bio-Well software calculates a range of objective parameters from the image. The official manual describes, among others:
- Area – the number of glow pixels,
- Normalized Area – glow area relative to the inner oval,
- Intensity – average intensity,
- Inner Noise – bright pixels in the inner region,
- Energy,
- Form Coefficient – a ratio related to outer contour length and area,
- Entropy Coefficient – a ratio involving the outer and inner contours,
- inner and outer radius and contour length.
These are mathematically definable properties of the image. The more difficult question begins when we ask what those numbers mean for a person.
What does the research literature say?
A systematic review of GDV use in health and disease was published in 2023. From an initial set of 108 publications, the authors included 42 studies in the final review: eight randomized controlled trials, five non-randomized controlled studies, 17 cross-sectional studies, ten single-group pre-post studies and two correlational studies.
This means that a research base exists and is not negligible. At the same time, the review authors explicitly stated that studies with more robust methodology and clinical validation are needed before definitive conclusions can be drawn.
That is a fair summary of the field as a whole: there are interesting signals, but not yet sufficiently consistent evidence for GDV to be used as a stand-alone clinical diagnostic method.
An earlier systematic review from 2010 also identified a substantial body of research and reported potential for rapid monitoring of psychophysiological states and responses to interventions. However, it is important to note that part of the literature came from conferences and environments directly connected with the development of GDV.
The scientifically safest description is therefore that GDV is a research and complementary measurement tool, not a substitute for laboratory diagnostics, medical imaging or clinical examination.
Why does corona shape matter more than it seems?
A large part of classical software reduces a highly complex image to a handful of global indicators. In doing so, much of the information is lost.
Imagine two images with the same glow area.
The first has an almost perfect, smooth ring of uniform thickness. The second has a deep gap on one side, a long radial protrusion on the other and a very thick corona elsewhere. The global Area can be similar, yet morphologically the two images are completely different.
Modern GDV analysis should therefore treat the corona as a two-dimensional morphological signal, not merely as a few numbers.
Basic morphological patterns in a GDV image
1. Corona continuity
The simplest question is how much of the fingertip circumference is surrounded by a connected corona.
Instead of subjective labels such as “good” or “poor” continuity, software can measure:
- the percentage of angle where corona is present;
- the number of interruptions;
- total angular width of interruptions;
- the largest single gap;
- whether a gap actually breaks the main connected component.
The last point is critical. A darker part of the glow is not necessarily a gap. If an algorithm simply counts lower-intensity pixels as “missing,” apparent fragmentation can become very high even in a visually continuous corona.
A more appropriate approach is geometric: first determine the main connected corona component, and then analyze its presence by angle.
2. Radial thickness
For each angle around the fingertip, the inner and outer corona boundaries can be measured.
Let them be denoted as:
r_in(θ) and r_out(θ),
so the local thickness is:
t(θ) = r_out(θ) - r_in(θ).
This produces a radial profile over the full 360 degrees.
From that profile we can distinguish:
- globally thin corona,
- globally thick corona,
- local thinning,
- local expansion,
- sudden radial protrusions.
This type of analysis contains far more information than a single average area value.
3. Local intensity
Thickness and brightness are not the same thing.
A corona can be:
- geometrically present but darker;
- thin but very bright;
- broad and diffuse;
- narrow and intense.
An advanced analysis should therefore maintain separate profiles for:
- presence
P(θ), - thickness
T(θ), - intensity
I(θ).
This helps prevent one of the most common errors in computer interpretation: classifying a local drop in brightness as a physical gap.
4. Protrusions, spikes and streamers
Radial protrusions are among the most visually obvious features in some corona images.
But several different phenomena can occur:
- a thin, long spike;
- a broad local plume;
- a branching streamer;
- several parallel streamers;
- an isolated bright dot;
- a satellite component close to the main corona.
The computer should first distinguish a connected protrusion that truly emerges from the main corona from an isolated artifact.
If the algorithm treats the last arbitrary bright pixel as the outer radius, a small droplet, dust particle or reflection far from the fingertip can create a false “huge streamer.” A better algorithm requires topological connection to the main corona and uses a robust local baseline.
For each streamer, the software can then measure:
- angle,
- length,
- width,
- area,
- intensity,
- branching,
- repeatability across consecutive measurements.
5. Edge roughness and boundary shape
Two corona rings can have the same area and the same average thickness while having completely different boundaries.
The edge can be described by:
- contour length,
- curvature,
- number of local peaks,
- area-to-convex-hull ratio,
- circularity,
- Form Coefficient,
- radial roughness.
A particularly interesting option is Fourier analysis of the radial profile. Low spatial frequencies describe large-scale asymmetry or ovality, while high frequencies describe fine jaggedness.
This allows a mathematical distinction between:
- global deformation,
- a few large protrusions,
- many small irregularities.
6. Fractality, entropy and texture
Fractal dimension and entropy frequently appear in GDV literature as measures of pattern complexity. Some studies have reported group differences in fractality or entropy, but results are not always consistent.
It is therefore better not to treat fractality as a mystical “degree of chaos,” but simply as one mathematical property of the image.
A more advanced approach can include:
- Shannon entropy,
- fractal dimension,
- lacunarity,
- GLCM contrast,
- GLCM homogeneity,
- GLCM energy,
- Local Binary Patterns.
A combination of texture features can distinguish images that have a similar global shape but very different microtexture.
The biggest hidden problem: acquisition quality
If we want to analyze small changes, we first need to know whether the image is of sufficient quality.
A GDV image can be affected by:
- skin moisture;
- perspiration;
- hand washing;
- alcohol or cleaning agents;
- temperature;
- room humidity;
- finger pressure and angle;
- finger position;
- the nail;
- contamination on the optical surface;
- isolated droplets or bright dots;
- device calibration.
Every serious system should therefore calculate a Quality Score first.
Example:
Image quality: 96/100
Centering: OK
Saturation: none
Satellite artifacts: 1 removed
Nail artifact probability: low
Corona usable for sector analysis: yes
This kind of quality control can be more important than adding yet another “energy” parameter.
Repeatability matters more than one spectacular image
A single image can contain a transient phenomenon.
If the same finger is captured three times in succession and an irregularity:
- appears 3/3 times → the sign is relatively stable;
- appears 1/3 times → transient noise or artifact becomes more likely.
This makes multi-capture consensus a particularly interesting development direction.
The software can:
- acquire three images;
- geometrically align them;
- calculate a consensus corona;
- determine which signs are stable;
- calculate variability.
In research methodology, this can be quantified using:
- coefficient of variation (CV),
- intraclass correlation coefficient (ICC),
- Bland–Altman analysis,
- standard error of measurement.
Critical research on Bio-Well/GDV has specifically raised concerns about the variability of some parameters. Rather than ignoring this, a new generation of software can measure and display that variability to the user.
That is a scientifically stronger approach.
Why are universal “normal values” not enough?
A particularly interesting normative study analyzed 880 healthy people in India. The authors found that some normative values differed from previously used European norms. The data were also not normally distributed, so percentiles and bootstrap methods were used.
This has an important practical consequence:
one universal threshold for everyone is not necessarily a good idea.
A more advanced system should use two kinds of reference.
Population reference
Comparison with an appropriate reference group according to:
- measurement device,
- protocol,
- age,
- sex when statistically relevant,
- population.
Personal reference
Even more importantly, a person can be compared with their own baseline.
If someone has a consistently lower corona area across ten measurements, that may represent their normal personal pattern. A sudden change relative to their own baseline may be more informative.
For this reason, longitudinal trends can be more useful than a one-off comparison with a population average.
What do clinical studies show?
The literature includes studies of different conditions: hypertension, oncological disease, diabetes, asthma, psychophysiological stress, responses to yoga, meditation and other interventions.
It is important, however, to understand what such studies can and cannot demonstrate.
A useful example is a pilot study of patients with colorectal neoplasia. It included 78 people, all of whom underwent colonoscopy as the reference procedure. Statistically significant differences were found between controls and the neoplasia group in several GDV parameters, including area, normalized area, intensity, inner noise, contours, fractality, entropy and Form Coefficient.
That is an interesting result, but it does not mean:
“GDV diagnoses cancer from an image.”
It means:
“In this pilot sample, some image features differed statistically between two groups and are worth further study.”
Diagnostic use would require a large prospective study, independent centers, a predefined algorithm and external validation.
GDV and HRV: why is the combination interesting?
Heart Rate Variability (HRV) is based on a completely different physical signal: the variability of time intervals between heartbeats.
The literature contains studies of correlations between some GDV and HRV parameters. The findings are interesting, but not consistent enough to support a universal rule such as “GDV parameter X means HRV parameter Y.”
The more appropriate approach is therefore multimodal:
- GDV shows a corona pattern;
- HRV shows regulation of cardiac rhythm;
- the two systems are analyzed independently;
- recurring patterns are then examined over time.
This is more robust than combining everything into a single mysterious “wellness score.”
Organs and sectors: the most sensitive part of interpretation
Modern Bio-Well and earlier GDV systems divide the fingertip circumference into sectors that an interpretive model associates with organs and systems. Historically, this model has been connected with acupuncture or meridian concepts and with clinical observations made by developers of the method.
An important point needs to be emphasized:
the sector itself is not a directly measured organ.
The device measures a light pattern at a particular fingertip angle. Only afterwards does a software atlas assign an interpretation to that angle.
The correct computational path should therefore be:
image → anomaly → exact angle → sector → atlas → interpretation
and not:
image → AI guesses an organ
If a visual anomaly lies outside the angular range of the sector associated with a particular organ, it should not be used as “visual confirmation” of that organ.
This may look like a small software detail, but scientifically it is a major distinction.
How can artificial intelligence help?
AI can be very useful in GDV, but not necessarily in the way it is sometimes presented.
The best approach is not to show a model an image and ask:
“What is wrong with this person?”
A much better architecture is:
- classical computer vision segments the corona;
- algorithms calculate objective features;
- the software determines angles and sectors;
- AI receives the original image, numerical data and the exact atlas;
- AI checks whether visual and numerical information are consistent;
- AI explicitly reports uncertainty.
AI is particularly useful for:
- finding inconsistencies,
- comparing multiple measurements,
- explaining complex results,
- combining many parameters,
- describing trends.
It should not independently invent relationships between a fingertip and an organ, or turn a small statistical difference into a clinical diagnosis.
The next generation of analysis: Corona Morphology Profile
Instead of a handful of global values, each image can be represented by a rich morphological profile:
Global morphology
  area
  normalized area
  mean / median intensity
  corona thickness
  circularity
  solidity
  eccentricity

Continuity
  angular continuity
  gap count
  total gap angle
  maximum gap

Edge
  perimeter
  curvature
  radial roughness
  Fourier spectrum

Streamers
  count
  longest streamer
  total streamer area
  branching

Texture
  entropy
  fractal dimension
  lacunarity
  GLCM
  LBP

Artifacts
  satellite dots
  inner noise
  nail/contact flags

Repeatability
  CV
  profile correlation
  persistent anomalies
Such a vector is suitable for both classical statistics and machine learning.
Machine learning: a major opportunity and a major trap
Machine-learning attempts are already appearing in the analysis of corona discharge images. Logistic regression, random forest, gradient boosting, SVM, KNN and other models have been used. The colorectal neoplasia study also used ROC analysis, discriminant analysis and logistic regression.
Medical data, however, make it very easy to obtain a model that appears excellent but is actually misleading.
If we have ten images from the same person and place some in the training set and others in the test set, the model may learn to recognize the individual rather than the disease. The result could appear to be 95% “accurate,” yet fail on completely new people.
A proper procedure requires:
- splitting by person, not by image;
- a sufficiently large sample;
- an independent reference standard;
- a predefined outcome;
- an external test center;
- probability calibration;
- model interpretability.
Machine learning is highly promising, but only after a high-quality data foundation exists.
Where is the real opportunity to go beyond classical Bio-Well analysis?
Not necessarily by adding more organs or more colored charts.
The greatest opportunity for progress lies in transparency.
A more advanced system could show, for every finding:
R4, 246°
Local thinning
Thickness: 2.8 robust standard deviations below personal baseline
Repeatability: 3/3 captures
Image quality: 96/100
Sector overlap: partial
Interpretation confidence: medium
The user can then see why the software flagged something.
Even greater value comes from:
- personal baselines;
- trends over months or years;
- automatic quality control;
- artifact detection;
- comparison of homologous fingers;
- separate display of GDV and HRV;
- reproducible storage of algorithm version.
Such a system is much more useful for research than software that produces a final result without showing the path used to reach it.
An important boundary: what can and cannot be claimed
Based on current knowledge, we can state with a high degree of confidence that:
- GDV/EPI generates a real and measurable gas-discharge pattern;
- many geometric and texture features can be objectively calculated from that pattern;
- the pattern is influenced by physical conditions, especially skin-surface state and measurement conditions;
- research reports statistical differences or correlations with some psychophysiological and clinical states;
- the field needs better standardization, repeatability and independent validation.
We cannot state with the same confidence that:
- an individual fingertip anomaly proves disease in a specific organ;
- GDV replaces laboratory or other medical examinations;
- the sector-based organ map is clinically validated for individual diagnosis;
- a colored “energy field” display is a direct photograph of an aura.
This distinction does not reduce the value of research. On the contrary, it makes the work more credible.
Conclusion
GDV/EPI sits at an interesting intersection of gas-discharge physics, image processing, psychophysiology, complementary models and data science.
The next serious step in development is not necessarily to add ever more interpretations. Greater value comes from improving the measurement itself:
- more accurate corona segmentation;
- robust artifact removal;
- gap and streamer analysis;
- radial profiles;
- Fourier and texture analysis;
- left-right homology;
- repeatability;
- personal reference values;
- longitudinal trends;
- clear confidence estimates.
With this approach, modern software can become analytically much richer than classical GDV/Bio-Well analysis without having to exaggerate medical claims.
In our view, the strongest future for this technology lies in the combination of good computer vision, transparent statistics, repeatable measurements and cautious interpretation.
That is the path by which an interesting experimental technology can develop into an increasingly serious research platform.
Sources and further reading
Bista S, Jasti N, Bhargav H, et al. Applications of Gas Discharge Visualization Imaging in Health and Disease: A Systematic Review. Altern Ther Health Med. 2023.
https://pubmed.ncbi.nlm.nih.gov/35648690/Korotkov KG, Matravers P, Orlov DV, Williams BO. Application of electrophoton capture (EPC) analysis based on gas discharge visualization (GDV) technique in medicine: a systematic review. J Altern Complement Med. 2010.
https://pubmed.ncbi.nlm.nih.gov/19954330/
https://doi.org/10.1089/acm.2008.0285Kostyuk N, Cole P, Meghanathan N, Isokpehi RD. Gas Discharge Visualization: An Imaging and Modeling Tool for Medical Biometrics. Int J Biomed Imaging. 2011.
https://pmc.ncbi.nlm.nih.gov/articles/PMC3124241/
https://doi.org/10.1155/2011/196460Pehek JO, Kyler HJ, Faust DL. Image modulation in corona discharge photography. Science. 1976.
https://pubmed.ncbi.nlm.nih.gov/968480/
https://doi.org/10.1126/science.968480Yakovleva EG, Buntseva OA, Belonosov SS, et al. Identifying Patients with Colon Neoplasias with Gas Discharge Visualization Technique. J Altern Complement Med. 2015.
https://pubmed.ncbi.nlm.nih.gov/26302046/
https://doi.org/10.1089/acm.2014.0168Engineering Approach to Identifying Patients with Colon Tumors on the Basis of Electrophotonic Imaging Technique Data.
https://pmc.ncbi.nlm.nih.gov/articles/PMC4994194/Kushwah KK, Srinivasan TM, Nagendra HR. Development of normative data of electro photonic imaging technique for healthy population in India. Int J Yoga. 2016.
https://pmc.ncbi.nlm.nih.gov/articles/PMC4728959/
https://doi.org/10.4103/0973-6131.171713Duerden T. An aura of confusion Part 2: the aided eye—“imaging the aura?” 2004.
https://pubmed.ncbi.nlm.nih.gov/15135764/Miraglia FE. Unreliability of the Gas Discharge Visualization (GDV) Device and the Bio-Well for Biofield Science: Part I. Journal of Anomalistics. 2024.
https://doi.org/10.23793/zfa.2024.080Miraglia FE. … Part II. Journal of Anomalistics. 2024.
https://doi.org/10.23793/zfa.2024.120
https://www.anomalistik.de/images/pdf/zfa/JAnom24-1_120_Miraglia_P2.pdfValverde R, Korotkov KG. Gas discharge visualisation technology for psychological research applications: A systematic review. 2025.
https://doi.org/10.38140/ijspsy.v5i2.1938Bio-Well Manual – technical definitions of image parameters.
https://www.bio-well.com/assets/files/Bio-Well_Manual.pdfBio-Well Manuals
https://bio-well.com/en-intl/pages/manualsMachine Learning Methods for Classifying Gas Discharge Images of Liquid Solutions. Preprint, 2025. A methodologically interesting example of data analysis of corona images; it does not represent clinical validation in humans.
https://www.preprints.org/manuscript/202508.1320
Note: GDV/EPI analysis is a research and informational method. It is not a medical diagnosis and does not replace a medical examination, laboratory tests or other established diagnostic procedures.