The physical measurement
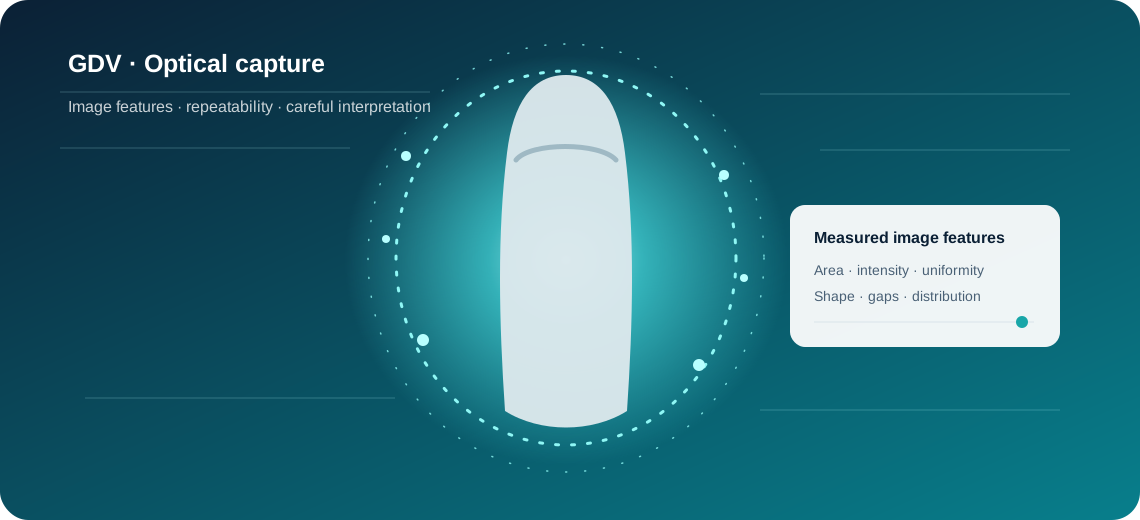
In GDV/EPI, a fingertip is placed on a dielectric surface and exposed to a brief high-voltage electrical excitation. The surrounding gas becomes ionised and produces a visible discharge. A camera captures the luminous pattern and software digitises it.
The discharge itself is a real physical phenomenon. What makes the field scientifically difficult is not whether a corona exists, but how strongly the image is affected by skin moisture, contact pressure, temperature, device settings and other physical conditions — and what biological meaning can legitimately be assigned to the resulting pattern.
What does the software calculate?
The first analytical layer is image processing. Depending on the system, calculated features can include area, normalised area, mean intensity, inner noise, contour length, form coefficient, entropy-related measures, inner and outer radius, asymmetry, continuity, local gaps, streamer length and image texture.
These are mathematical descriptions of an image. They are not diagnoses. A more advanced morphology workflow can preserve local information that would disappear if the whole image were reduced to one score.
Why image quality matters
Finger position, pressure, skin moisture, hand washing, temperature, optical contamination and saturation can alter a capture. Serious analysis should therefore ask whether an image is technically usable before assigning meaning to it.
A quality layer may include centering, clipping, saturation, sharpness, suspicious satellite pixels and continuity checks. Quality scoring does not validate a biological interpretation; it reduces avoidable measurement noise.
Why repeatability matters more than one image
A single unusual capture can be transient. If the same feature appears in repeated technically valid captures under similar conditions, it becomes a stronger research observation. Longitudinal tracking adds another level: compare the person with their own baseline rather than relying only on one population threshold.
For reproducibility, preserve the original image, device/calibration state, capture time, finger identity, software version and failed or repeated captures.
GDV, EPI, Bio-Well and Kirlian photography
GDV means Gas Discharge Visualization. EPI means Electro-Photonic Imaging and is overlapping terminology used for modern digital implementations. Kirlian photography is the historical high-voltage corona-imaging tradition. Bio-Well is a commercial hardware/software ecosystem that uses GDV/EPI principles and its own analysis model.
That distinction is important when searching for “Bio-Well software” or “GDV software”. An independent program may analyse compatible measurements without being the manufacturer's official software.
What about organ and sector maps?
Some GDV systems map angular segments of finger images to organs or physiological systems. The camera does not directly observe an organ. The analytical chain is better described as image → measured feature → angular sector → atlas → interpretation.
This is why a sector result should be presented differently from a raw image metric. The first is model-dependent; the second can be recalculated directly from the captured image.
What does published research say?
GDV/EPI has been studied in health, stress, intervention and psychophysiological contexts. A 2023 systematic review included 42 studies after selection and concluded that stronger methodology and clinical validation are needed before definitive conclusions can be made.
That supports a balanced position: GDV/EPI is a legitimate subject for measurement research, but it should not be presented as a stand-alone clinical diagnostic method.
Where GDV Studio fits
GDV Studio is an independent Windows analysis environment by PICALLW. It is designed around local image review, morphology, capture quality, repeated measurements, personal baseline and longitudinal comparison. Direct capture is currently confirmed with Bio-Well 2.0, and original BDF measurements can be opened for local analysis. Bio-Well 3.0 compatibility has not yet been confirmed.
What is established, uncertain and not established?
| Level | Example |
|---|---|
| Established physical measurement | A high-voltage excitation can produce a measurable gas-discharge light pattern. |
| Objective image analysis | Area, intensity, contour and morphology can be calculated from the image. |
| Research question | Whether specific features correlate reproducibly with psychophysiological states. |
| Not established as direct measurement | Individual organ disease, “aura” or a medical diagnosis from a finger image. |
Sources and further reading
- Pehek, Kyler & Faust – image modulation in corona discharge photography
- Kostyuk et al. – GDV imaging and modelling
- Bista et al. – 2023 systematic review of GDV applications
- Official Bio-Well FAQ