Why local BDF analysis can be useful
A measurement file is more valuable when the original capture can be revisited. A final report may show summary values, but research questions often arise later: Was the image technically clean? Was a local gap present in more than one capture? Did the same feature persist across sessions? Was the difference larger than normal day-to-day variability?
GDV Studio is designed to make that second look easier. It does not require a user to treat the first interpretation as final. Instead, the workflow starts with the original measurement, then moves through quality, morphology, repeatability and only then interpretation.
1. Open the original BDF measurement
The BDF file remains the source measurement. GDV Studio reads the measurement and presents the captured finger images together with the available measurement data. The goal is not to silently replace the original file, but to provide an additional analysis environment around it.
For research traceability, keep the original BDF file unchanged and store exported reports or derived analyses separately. That makes it possible to return to the source if algorithms or interpretation rules change later.
2. Check capture quality before interpreting anything
Every image-analysis system is vulnerable to capture artifacts. Skin moisture, contact pressure, finger angle, optical contamination, saturation, isolated bright pixels and incomplete positioning can all change a corona image. The first question should therefore be: is this image good enough to analyse?
A useful quality layer can flag centering, clipping, saturation, contrast and suspicious satellite components. It cannot guarantee biological validity, but it can prevent obvious technical problems from being mistaken for meaningful patterns.
3. Look at morphology, not only one global number
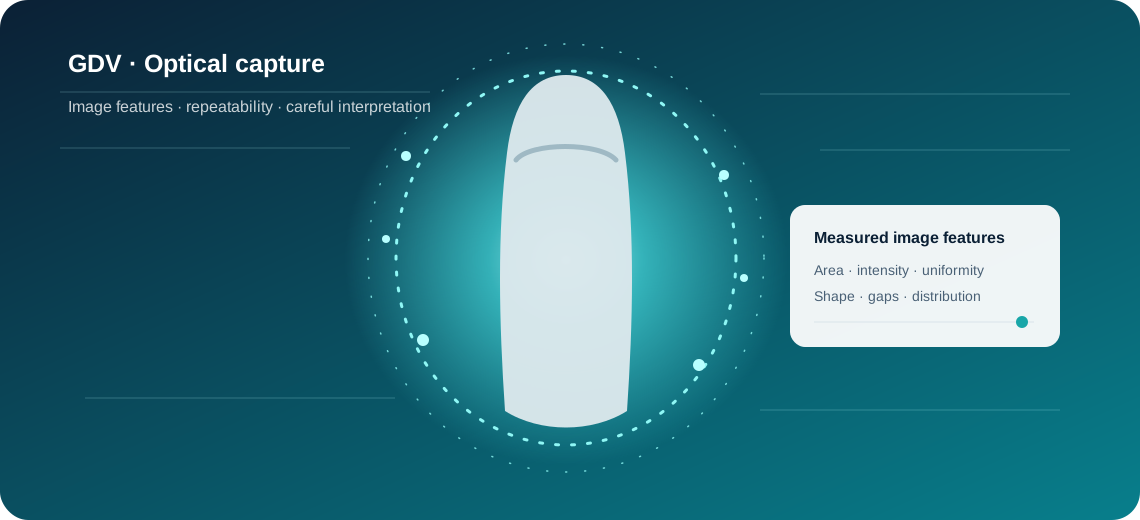
Two images can have a similar total area and still look very different. One may be smooth and continuous; the other may contain a large local thinning, a gap or a long streamer. GDV Studio therefore treats the corona as a two-dimensional image signal.
Relevant descriptive features include continuity, radial thickness, local intensity, outer-edge roughness, asymmetry, gaps, streamers and texture. These are image properties first. Any biological or sector interpretation should be a separate layer.
4. Compare repeated captures
A single unusual image is difficult to interpret. Repeated captures provide more information. If a local feature appears in three technically good captures, it deserves more attention than a feature visible once and absent immediately afterwards.
This is where a local analysis workflow becomes especially useful: the same image metrics can be recalculated with the same algorithm version and compared side by side.
5. Use a personal baseline
Population reference ranges can be useful, but an individual's own history may be even more informative. Some users have stable personal patterns that sit away from a generic average. A sudden deviation from a well-established personal baseline can therefore be more meaningful for research than a one-time comparison with a universal threshold.
Longitudinal work should preserve the capture protocol as much as possible: similar time of day, hand preparation, environment and device settings.
6. Keep sector interpretation separate
In Bio-Well/GDV traditions, angular sectors around finger images are mapped to organs or systems. The device itself does not directly measure an organ. It measures a gas-discharge image at the finger, and the software applies an interpretive atlas to angular positions.
A transparent workflow should therefore preserve the chain: image → measured feature → angle → sector → interpretation. This is stronger than allowing an AI model to jump directly from an image to an organ statement.
7. Add HRV or ECG only as a separate signal
When HRV/ECG is available, it should not be blended into a single unexplained wellness score. HRV is derived from beat-to-beat cardiac timing; GDV is an optical/electrical discharge image. They are different physical signals. They can be compared over time, but each should retain its own measurement meaning and quality criteria.
8. Export a report that preserves uncertainty
A good report should distinguish measured quantities from interpretation, show capture-quality limitations and identify whether a result is a single observation or a repeated pattern. For research use it is also valuable to preserve software version, algorithm version and measurement time.
Bio-Well Software and GDV Studio are not the same product
Bio-Well Software is the official software environment for Bio-Well hardware. GDV Studio is independently developed by PICALLW. Direct capture in GDV Studio is currently confirmed with Bio-Well 2.0; compatibility with Bio-Well 3.0 has not yet been confirmed.
The two environments can therefore be understood as different approaches rather than a claim of replacement. The official ecosystem provides the manufacturer's workflow; GDV Studio adds an independent local analysis path focused on morphology, repeatability and longitudinal research.