Why does an automation workflow often break into disconnected steps?
On site, the engineer first discovers devices and verifies BACnet objects, Modbus registers, KNX group addresses or a Climatix hierarchy. Once communications work, another project begins: visualization. Addresses are re-entered, points receive new labels and bindings need another round of verification. After the HMI is designed, a third problem appears: how to deliver it to the Android device in a controlled way.
Each phase can work well in isolation, but the handoffs create extra work. With hundreds of points, repeating the data model becomes a major problem. That is why a shared project context matters.
1. NODVIA Field — the real project environment
NODVIA Field is the commissioning and service environment. It discovers devices, verifies communications, reads and where supported writes values, and stores project context. Its job is not to be the final operator HMI, but to give the engineer fast access to real devices and data.
For BACnet, this can mean devices, Device ID, IP/port context and objects. For Climatix, the project can include SCOPE hierarchy, points, schedules and history/trend objects. Other protocols and service tools remain part of the wider Field toolbox.
2. NODVIA Studio — project-aware HMI designer
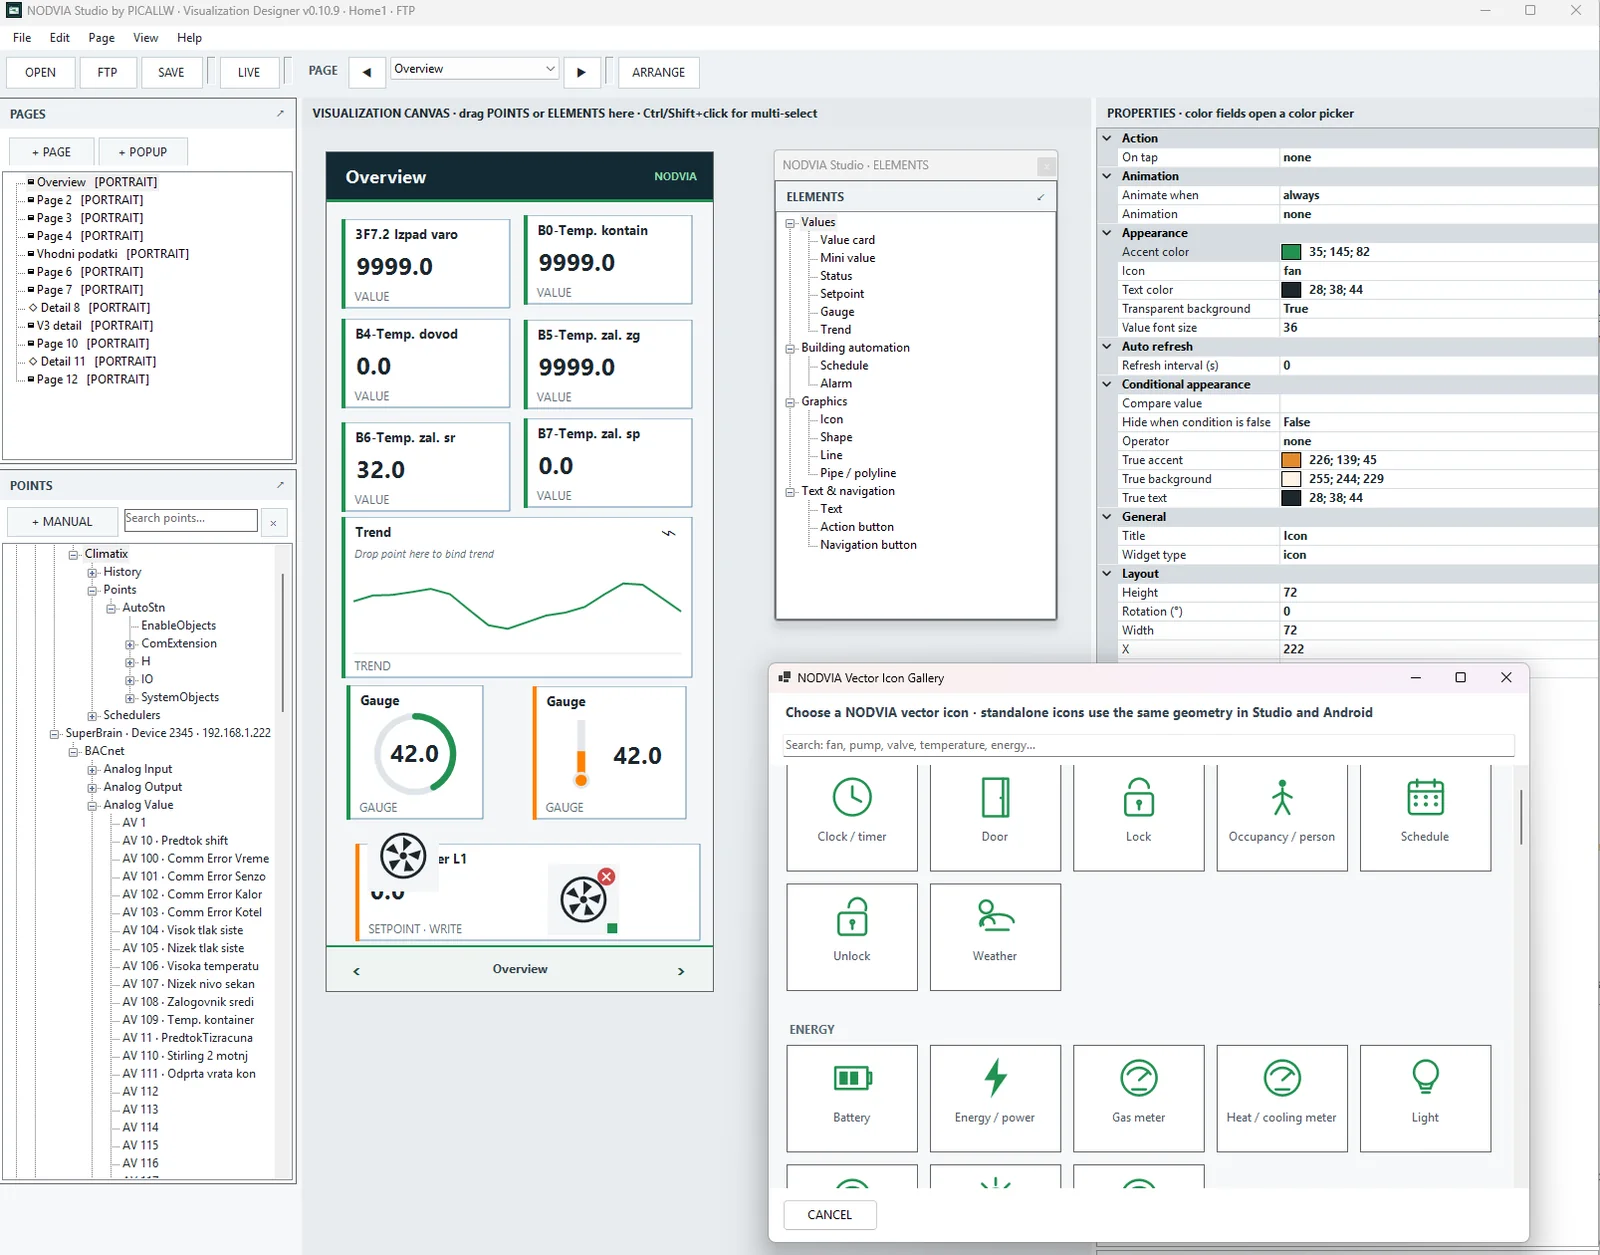
NODVIA Studio opens the project and uses its point tree. Instead of typing Device ID, object instance or Climatix path again, the user selects an existing project point and drags it onto the visualization canvas.
Studio supports pages and popups, live values, status, setpoints, gauges, trends, schedules, icons, shapes, lines and pipes. Its vector library contains HVAC and automation symbols. A project can be portrait or landscape with title bar, navigation and a fullscreen-oriented runtime.
Allow write as a project decision
The key difference between display and control is write permission. An element that only displays a value is not automatically a control. When Allow write is enabled in the project and the binding is suitable, the element can act as a setpoint or writable control. The runtime still respects project licensing, binding and protocol constraints.
3. The new Studio role: NODVIA Cloud
NODVIA Studio is no longer only a local designer. Cloud functions are now part of the project workflow. Studio includes Partner ID/API key settings, a stable Project ID in the NVP-… format, HTTPS Publish, deployment link/QR and View license/seat status.
Publishing sends the project package, visualization files and manifest to Cloud. Cloud tracks the current version and SHA-256 so downloads can be verified for integrity.
Browse / Open Cloud Projects
A particularly useful feature is that Studio can not only publish a Cloud project but find and reopen it later. A partner can browse projects and see Project ID, Customer, license state, used/allowed seats, current Cloud version, package size and modification date.
Studio can download the selected project, verify SHA-256 and open it together with its visualization data. That supports a more practical maintenance workflow: the project is not trapped on one local workstation and can be recovered from the central project repository.
4. Project ID as the link between all parts
Project ID looks like a small feature, but it is architecturally important. A local filename can change, Customer and Project Name are for people, while NVP-… is the stable machine identity of the project.
Project ID is used for publishing, license requests, seat status, deployment links and Android View activation. The same visualization can therefore receive a new Cloud version without rebuilding the configuration manually on every device.
5. NODVIA View — standalone Android HMI runtime
NODVIA View is the new standalone member of the family. This is an important change from the earlier development phase when Project Visualization was primarily shown inside NODVIA Field.
View is a dedicated fullscreen HMI runtime. It does not build the Field HOME/BACNET/MODBUS/TOOLS/PROJECTS navigation and the user does not get the service toolbox. Without an active project, the app remains in the View registration/project workflow. This separates the operator runtime from the commissioning environment.
Deployment by QR or Project ID
View can receive a project through Project ID, a deep-link deployment URL or QR code. The QR scanner uses the phone camera; after scanning, the app extracts the Project ID, activates the project and downloads it from PICALLW Cloud.
Multiple projects and project lifecycle
View supports multiple projects. Users can open the project list and use OPEN, UPDATE or DOWNLOAD. This is useful on devices used across multiple sites or partner/service scenarios.
6. HMI capabilities in View
View uses the visualization project from Studio and can render live values, status, gauges, graphical equipment, pages, popups, title/navigation elements and supported writable controls. Write behavior is not linked to NODVIA Field PRO; it checks the View project license/trial and the project Allow write.
Trends include an interactive cursor/value, range zoom and reset/FIT. Schedules use a graphical workflow that validates times, event order and protocol-appropriate values before writing. BACnet and Climatix writers remain protocol-specific and use read-back verification.
7. Why should Cloud not become a critical automation dependency?
In this architecture PICALLW Cloud handles project delivery, activation/licensing and deployment visibility. That is a different job from the automation process itself. NODVIA remains local-first: the cloud should not be the reason basic HMI operation or local automation stops during a short internet outage.
A signed activation/license can therefore support offline operation after successful deployment. Cloud remains the controlled channel for versions, deployment and project changes.
8. What does the system integrator gain?
The main benefit is not one specific button. The value is reducing handoffs between project phases:
- Field: real devices and project database,
- Studio: HMI design from the same points,
- Cloud: identity, version, deployment and status,
- View: dedicated Android runtime.
When the project changes, Studio can reopen the Cloud version, modify it, publish a new revision and View can update the project. This is much closer to the lifecycle of a real automation platform than a simple “export JSON and copy it to the phone manually” workflow.
9. Where does Project Visualization remain inside NODVIA Field?
Project Visualization in Field still makes sense as a commissioning and test view. The engineer can verify bindings, page layout, trends or schedules on the same device and return to the service tool. For standalone operator use, the new role is clearly separated: NODVIA View.
Conclusion
This moves NODVIA from a rich field toolbox toward a connected project system. Field connects the project to the real world, Studio designs the HMI and manages Cloud, Project ID connects deployment, and View separates the operator screen from the service environment.
The shortest description of the new architecture is: