NODVIA Field
Discovery, diagnostics and commissioning. Devices and points become part of the project.
Field →Design locally. Deploy through Cloud.
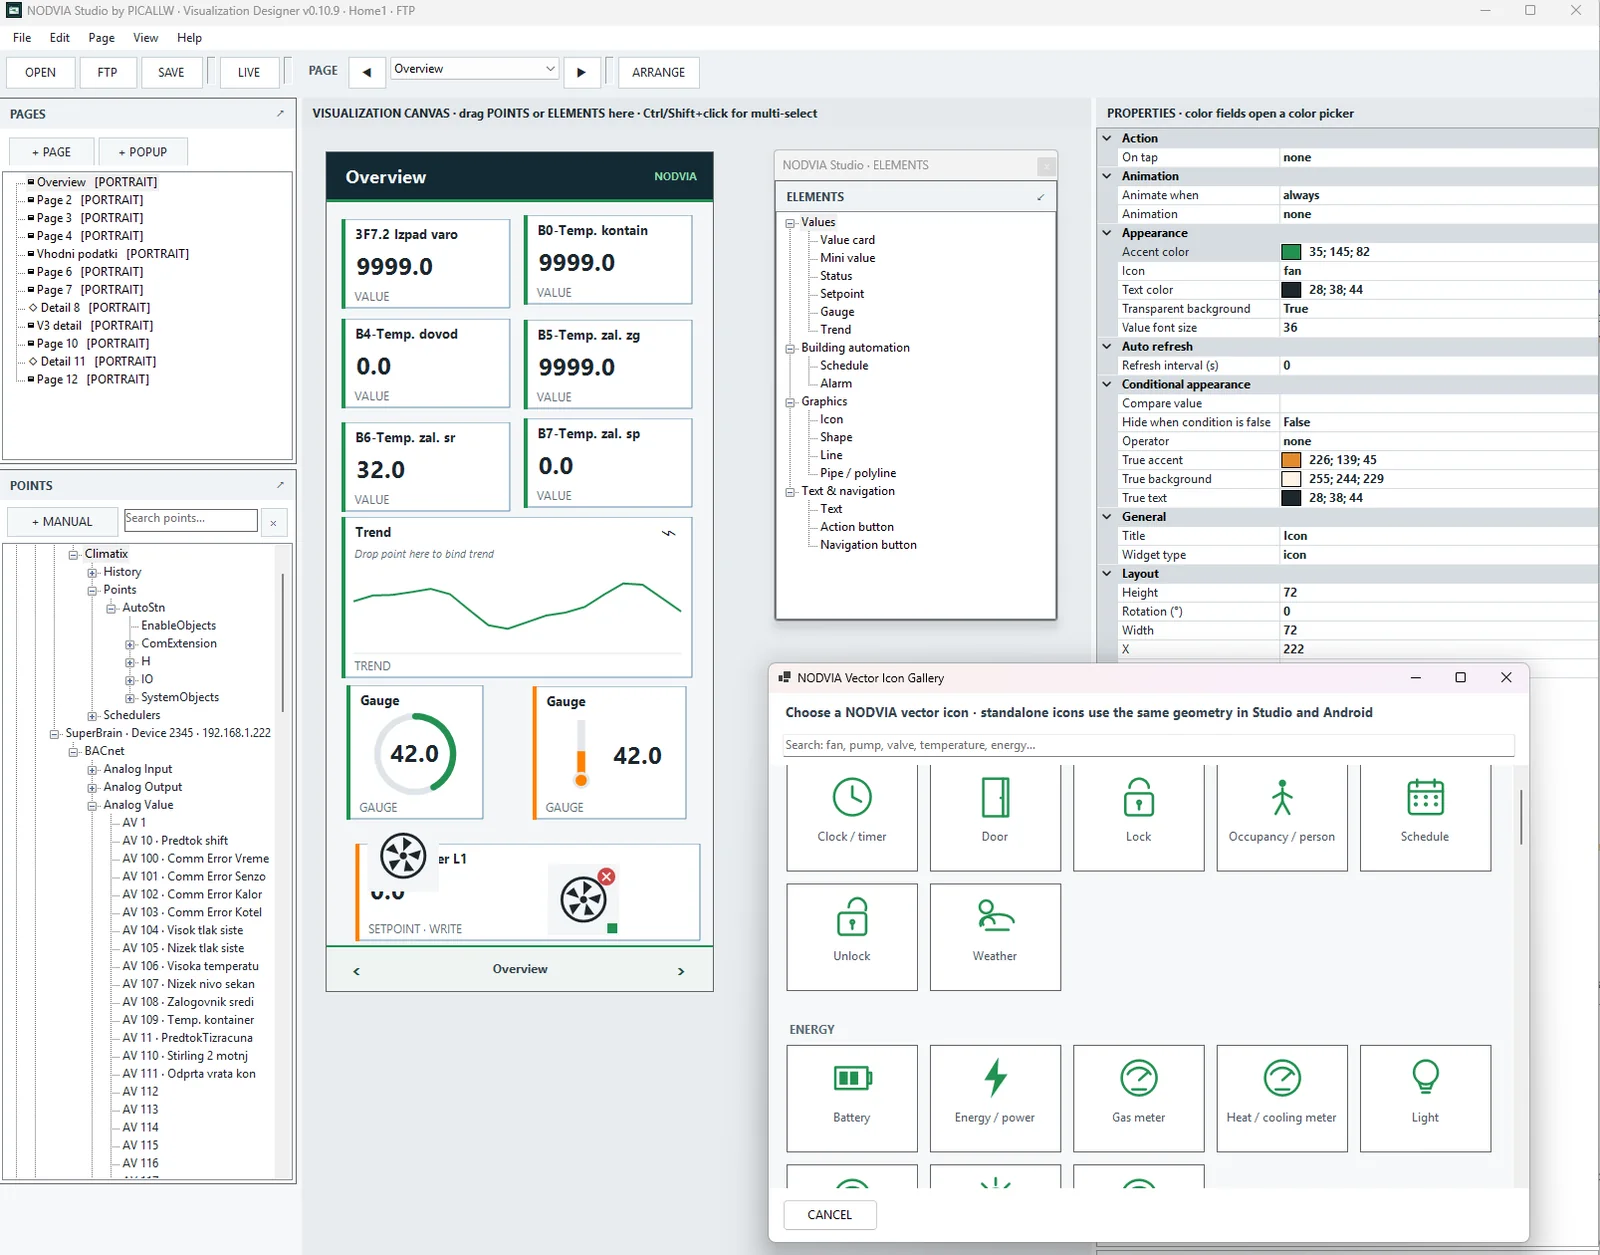
NODVIA Studio is the visual HMI designer and NODVIA Cloud project manager. It uses real project points, designs pages and popups, and publishes the same project to PICALLW Cloud for deployment in NODVIA View.
ACTIVE DEVELOPMENT · FIELD TESTING · Studio is being developed as the project and deployment center for NODVIA HMI.
Field builds project context. Studio uses the points and designs the HMI. Cloud delivers the project and licensing context. View runs it as a standalone Android runtime.
Discovery, diagnostics and commissioning. Devices and points become part of the project.
Field →Project tree, search, drag-and-drop HMI, pages, popups, schedules, trends and vector graphics.
HTTPS publish, stable Project ID, version, SHA-256, deployment link/QR and licensing context.
Standalone fullscreen Android HMI for the assigned project.
View →The key difference from a generic HMI drawing tool is project context. Studio can use devices, points and metadata already organized in the NODVIA project.
BACnet devices and objects, Device ID, IP/port, Object Name, Description, units and other project metadata remain connected with the point.
Search larger projects by name, description, object type, instance, Device ID, address, units or device path.
A project can contain the Climatix SCOPE structure, normal points, schedules and history/trend objects used by the Studio HMI workflow.
Drag a point from the project tree onto the canvas, position and resize the element, then configure its properties. Studio is designed for working with real automation points rather than re-entering addresses manually.
Built-in HVAC and automation symbols help create consistent HMI graphics without an external drawing package.
State, colors and selected animations can be bound to project values.
The Cloud layer is more than a ZIP upload. Studio understands project identity, customer, partner, deployment and View licensing status, and can reopen active Cloud projects directly from the application.
The project package contains project data, visualization and manifest. Publishing tracks version and SHA-256 for download verification.
Every Cloud project has a stable NVP-… Project ID connecting Studio, deployment and Android View installations.
Studio provides the Project ID and deployment link, which can be copied, opened or used for QR deployment.
A dedicated window shows license state, used/allowed seats, requested seats and active installations.
Studio can list a partner’s projects, filter by customer/status, and open, download or copy the deployment link for the selected project.
When opening a Cloud project, Studio downloads the current package, verifies SHA-256 and opens the project together with its visualization file.
This matters for teamwork and maintenance. Studio is no longer limited to the local copy: a partner can see Cloud projects, inspect status, download the current version and reopen it for changes.
Project Name and Customer help distinguish projects when a partner manages multiple customers or several HMI projects at one site.
Commissioning, protocol diagnostics, discovery and project data.
Field →HMI design, Cloud publish, Project ID, deployment, View license/seats and Cloud project management.
Standalone Android runtime for fullscreen operation of the assigned project.
View →The updated technical article explains how a shared project model reduces manual work and how Field, Studio, Cloud and View complement each other.
Studio turns real project points into an HMI and prepares them for NODVIA View through Cloud deployment.